|
Many
customers are under the impression that you will see a
“photograph” of the subsurface, similar to what you would see if
you carefully excavated all the soil from around the buried
utilities to reveal them. Unfortunately this is a misconception
reinforced by popular forensic crime TV.
On a radargram,
a utility will be hyperbolic in shape and look like an inverted
“U”, with the actual utility being located at the peak of the
hyperbola
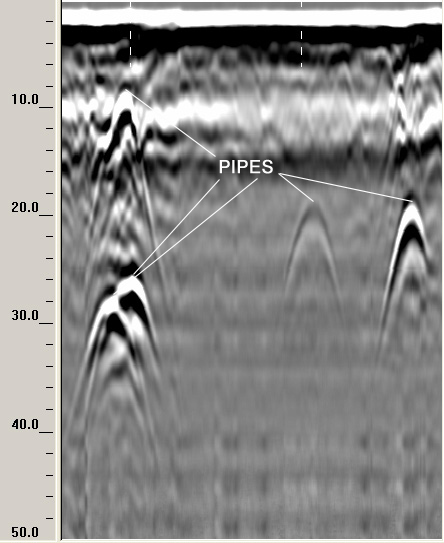
In good quality GPR data these are normally easy to spot,
however in noisy data it can be challenging, especially with
small shallow utilities which tend to be more inverted-V shaped
and can look like noise. For this reason it is always
recommended to survey at a pace at which you have time to
examine the data carefully as it scrolls across the screen.
NEXT UP: Can GPR measure density?
For additional info please contact us at reddog@geoafrica.co.za
or call Terry at +27-82-89-29-771
|